
Background
If you want to try our product directly, check this link: https://map.findperth.com
Motivation
In the vast expanse of Western Australia, a wealth of public datasets remains an untapped resource for many. While these datasets are openly available, not everyone possesses the digital skills necessary to access and interpret this valuable information. This accessibility gap means that the full potential of these data resources is not being realized, leaving many citizens without the benefits they could provide.
Our vision is to bridge this gap with a two-tiered technological solution that makes data not only accessible but also comprehensible to every resident of Western Australia, regardless of their technical ability.
Solution
Level 1 Solution: Centralized Data Platform
At the foundational level, we propose the creation of a centralized database that hosts various structured data formats such as CSV, JSON, and shapefiles. This platform will serve as a beacon for data democratization, presenting these datasets in a user-friendly format. By transforming raw data into insightful visualizations and summaries, we enable residents to gain valuable insights effortlessly, thus enhancing their understanding and engagement with the data.
Level 2 Solution: Conversational Data Interface
To cater to the diverse needs of approximately three million residents, we envision a more advanced solution leveraging the latest in AI technology, including Large Language Models (LLMs) and Text2SQL capabilities. This innovative approach involves a conversational interface that allows users to interact with the data in natural language. Users can pose questions and receive answers generated through sophisticated queries that pull information from multiple data sources. This level of interaction represents a significant leap towards truly personalized data interaction, making it as simple as having a conversation.
Together, these solutions not only enhance digital inclusivity but also empower all residents of Western Australia to make informed decisions based on the rich data landscape that surrounds them. By providing these tools, we are not just offering access to data; we are unlocking a world of opportunities for education, engagement, and empowerment through information.
How we implement this?
Gathering data
We started with the data we are interested in first: Crime Data, ABS 2021 data, School intake area data.
Data sources
- WA Government Public Data Access: https://data.wa.gov.au/
- ABS data across whole Australia: https://www.abs.gov.au/
- You can access a diverse data from the TableBuilder
- WA Police Website: https://www.police.wa.gov.au/Crime/CrimeStatistics#/start
- WA Education Website: https://www.education.wa.edu.au/school-data-and-performance
ETL
However, the data sources are with different formats, so we need to find a way to extract, transform and then load them into a central database (ETL). Easiest one is the WA Government Public dataset, you can easily read them through the pandas, and then do to_sql operation, and save them into the database. For the WA Police one, unluckily, they have not provided an official endpoint to download all the data, we found out they do use the RESTFul API with public access, so we genetly pull the data for all suburbs from their website. TableBuilder, you have the ability to export the csv files, which makes the life very easy. WA Education is the one still in progress, we only have basic information and the intake area there, need to find a way to pull the data in a easier format.
And we plan to add more data into this central database.
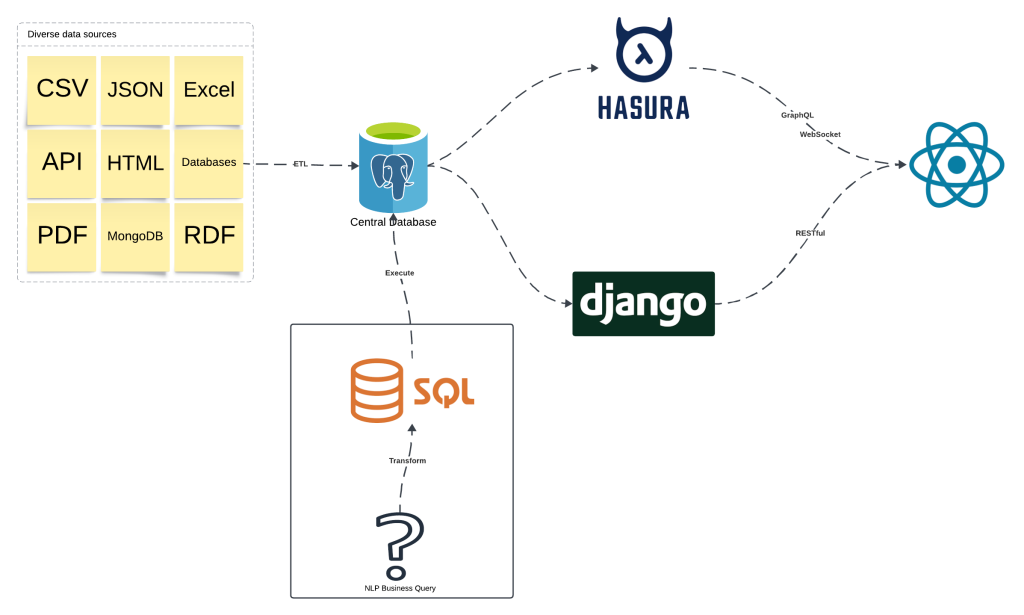
Workflow

The general workflow for the solution is like above
- ETL process to gather and load data into a central database, which is backed by the PostgreSQL database
- Django is in charge of the authentication, database migration, custom endpoints, AI ability
- LLM and Text2SQL functions happen here
- Hasura can automatically generate the GraphQL endpoints for you, and provide the subscription ability, which allow frontend to be updated in real time.
- Frontend is with React
Implementation notes
To implement the Level 1 solution, it is quite straightforward, which is the standard data engineer workflow or a business analyst job. The hard part is to know what the users really care about. So we need to design a UI/UX, which allow you to check everything we have, for example for the Crime Data (which is a one table data, large but simple structure)
However, for the ABS 2021 datasets, it is more diverse, it is not practical to expose all the data information in the frontend, as user will drown in the information ocean. So what we can do for Level 1 solution is to generate a list of predefined report, and visualise them.
And this leads to the Level 2 solution attempt, generating the report based on the business query directly via the AI (LLM and Text2SQL) models.
Research Component
So the hard problem to solve here is NLP Business Query => SQL Query
Decompose the problem
This problem has several levels of the difficulity
- The models (LLM or Text2SQL) provided with full table information (columns and all values) [One table, all information]
- The models provided with only (table column information + value distribution information), however no realy value, and limit to only one table. [One table, structure information]
- The models need to generate queries across multiple tables with the structure information across the whole database provided. [Multiple tables, full database structure information]
- The models need to gnenerate queries across mutliple databases, multiple tables. [Multiple tables, multiple databases, structure information]
[One table, all information]
This is very easy and straightforward, all information are provided, and the LLM are good at summarizing the information and provide proper response. This will be the base we work towards: to give the end user a natural language response, we will need to provide LLM with all of the relavant information for that query.
[One table, structure information]
This is a bit harder, however, still controllable, the Crime Table we have is under this category, and the table is looking like this.

So if we feed the column name, the distribution for each column (for locality, feed all possible suburbs, for numeric columns, feed the min/max summary description) to the LLM, it can generate a pretty good SQL, and get data back via that, and return user and good response.

[Multiple tables, full database structure information]
This is the hard one, if we feed all database schemas into the LLM, it can not handle it well, espeically when you try to generate complex results, for example, the map report within our application.
So we take one step back, thinking about how human solve this problem:
- We will first understand the database structure and the domain knowledge.
- And then we based on the query, identify the relevant tables.
- We construct the SQL query across the tables we identify.
At the same time, most of the attempt to solve this Text2SQL problem are trying to feed the whole database schemas to the models: https://github.com/awslabs/unified-text2sql-benchmark
One of the reason is the public dataset we have, actually is not that complex(normally 6-7 tables), so you still can feed them all into the context of LLM or models, and the model can be able to identify the attention part. However, our dataset contains 67 tables for ABS2021 data, which is not practically for us to do that.
It poses a signficant challenge to the work we have done until now.
To solve this problem, our plan is:
- Create a MetaGraph, or Knowledge Graph for the database tables, represent their columns, FK, value distribution, semantic information. Embedding each node.
- Then convert the business query into embedding, and then do similarity search, identify the relevant nodes.
- Do graph shortest path run, “vote” for which tables are relevant.
- Use the winner during the voting stage as the relevant tables, prompt the LLM.
- Get the SQL and exectue it.
The step 3 is a re-rank process, and is the core part for our approach.
It actually works well, and all the reports here are generated in this way.

[Multiple tables, multiple databases, structure information]
It is very hard, our team is still working on it, and show some promising results, we will share it when we have a good solution.
Solution Presentation
This is one of the talk we have gaven during the Latency 2024. You can also access the platform via: https://map.findperth.com


