Home Case studies How much carbon could the biomass near your site displace?
Case study · Energy and decarbonisation
How much carbon could the biomass near your site displace?
Farm, forestry and food residues can replace diesel and coal, but only if there is enough of it close by. BiomassFlux answers that for any place in Australia: supply, haulage, plant size and CO₂ avoided, in one click, with every assumption shown.

Why it matters now
Emissions have a cost. Biomass is one way down.
Under Australia's Safeguard Mechanism, the country's largest industrial emitters, many of them WA mines and processing plants, must bring their emissions down every year or buy carbon credits to cover the gap. Diesel and coal heat are hard to cut.
Residues from farms, forestry and food processing can replace some of that fuel. But every project starts with the same questions, and they used to take weeks of spreadsheets: how much is there, how far away, what will hauling it cost, and how much CO₂ does it actually save once the trucks are counted?
- Pick a placeClick a point and set a radius, or draw any shape on the map.
- SupplyResidue tonnes and energy inside it, by feedstock, from state assessments.
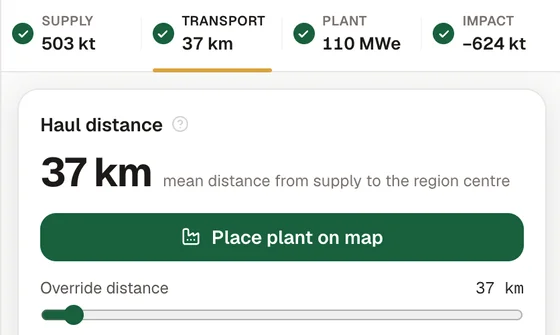
- TransportDiesel, fuel cost, truck loads and CO₂ for hauling it, both ways.
- Plant and impactSix end uses side by side, and the net CO₂ each one avoids.
Worked example: 50 km around Northam
Real output from BiomassFlux for the wheatbelt east of Perth, with its default assumptions. These are theoretical residue totals from the state assessments; the share a project can actually secure is set by contracts and by how much stubble farmers keep on the paddock.
Six ways to use the same residue
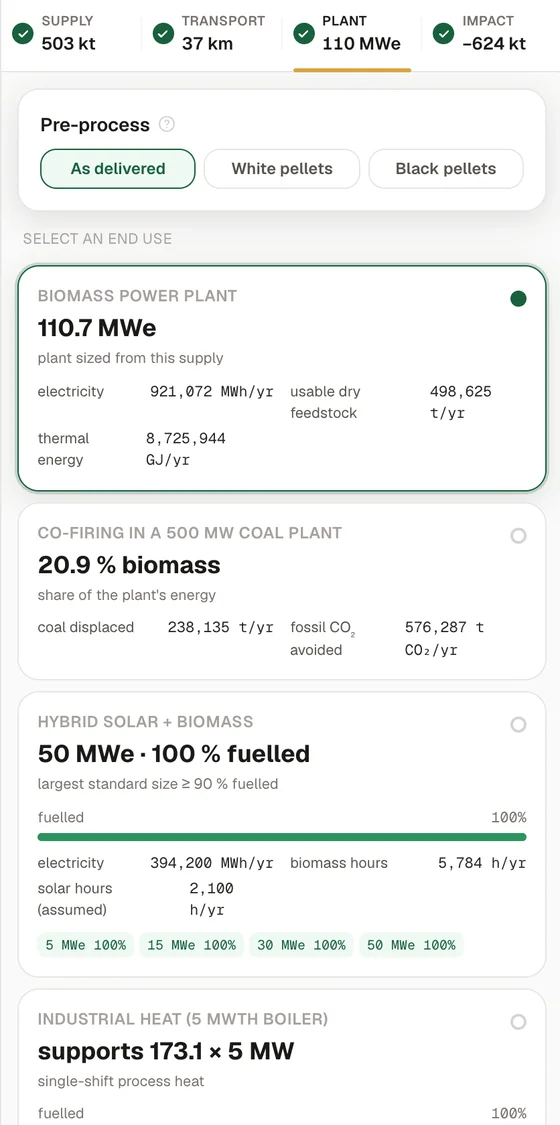
The same 503 kt, compared side by side. Pick one and the impact tab shows its net carbon.
Biomass power
110.7 MWe921 GWh of electricity a yearCo-firing with coal
20.9%of a 500 MW coal plant's energy; 238 kt of coal and 576 kt of CO₂ avoided a yearHybrid solar + biomass
50 MWefully fuelled, the largest standard sizeIndustrial heat
173 boilersof 5 MW each, single-shift process heatBiochar
149.6 ktof biochar a year, storing 411 kt of CO₂, plus bio-oil and syngasLiquid fuels
67.3 MLof renewable diesel or aviation fuel a year, or 187 ML of methanol
The carbon sum
Net, not gross
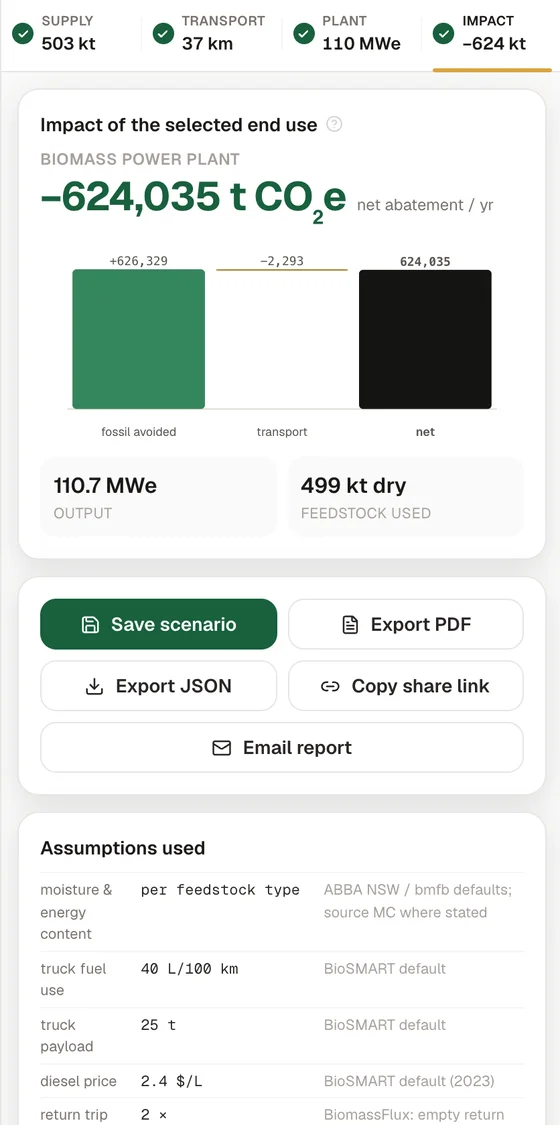
A carbon number is only useful if it subtracts what the project itself emits. BiomassFlux takes the fossil CO₂ an end use displaces and subtracts the diesel burnt hauling the residue, using the National Greenhouse Accounts factors.
Here the trucks cost 0.4% of the saving. For residue hauled further, or a smaller end use, that share grows, and the tool shows it.
Tonnes of CO₂e a year, biomass power plant, 50 km around Northam.
Built to be checked
Every number shows where it came from
The calculations follow the published methods of CSIRO and NSW BioSMART, and automated tests check them against those formulas. Where we differ we say so: BiomassFlux counts the empty truck coming back, which BioSMART leaves out.
Behind the supply numbers are 40 public data sets: state biomass assessments, satellite biomass maps, facilities and boundaries, each logged with its source, licence and retrieval date. Gaps are recorded too, for example only 11 of 43 Victorian residue files could still be downloaded.
- Haulage40 L/100 km, 25 t loads, return trip counted
- Diesel emissions3.382 kg CO₂e/L, National Greenhouse Accounts 2023
- Coal displaced2.42 t CO₂ per tonne of black coal
- Power plant38% efficiency, 95% feedstock use
- Biochar0.30 t biochar, 250 L bio-oil and 1.5 GJ syngas per dry tonne
- Every input editablechange any assumption and the results update
Honest limits
What it doesn't do yet
- Collectable supply. Residue totals are what the state assessments estimate exists, not what a project can contract. A real study adds farmer surveys and soil retention rules.
- Prices and counterfactuals. Feedstock prices by region, and what the residue would emit if left to rot or burnt, are the next things we are adding.
- Carbon credits. It works out tonnes of CO₂ avoided. It does not value carbon credits or prepare Safeguard reporting.
Who it helps
Mines and processors
Test whether biomass heat or fuel could cut emissions at a site, before paying for a feasibility study.
Energy developers
Screen sites for a biomass, co-firing or hybrid solar plant in minutes rather than weeks.
Agribusiness and councils
See what your straw, manure or organic waste could be worth as fuel or biochar.
Got a site in mind?
We can model a specific site with your own data and constraints, or build the same kind of calculator for your team. More on AI and data for energy and decarbonisation.
Keen to have a chat?
Schedule a coffee chat in Perth, an online meeting or an in-person meeting at your office. A rough idea of what you'd like to improve is plenty.